Flagship · Now available

Your own trading terminal.
On your own computer.

Market breadth, charts, pattern screeners and sector rotation for India and the US, in one place. It runs in your browser from a folder on your machine, so your watchlists, drawings and notes never leave it.

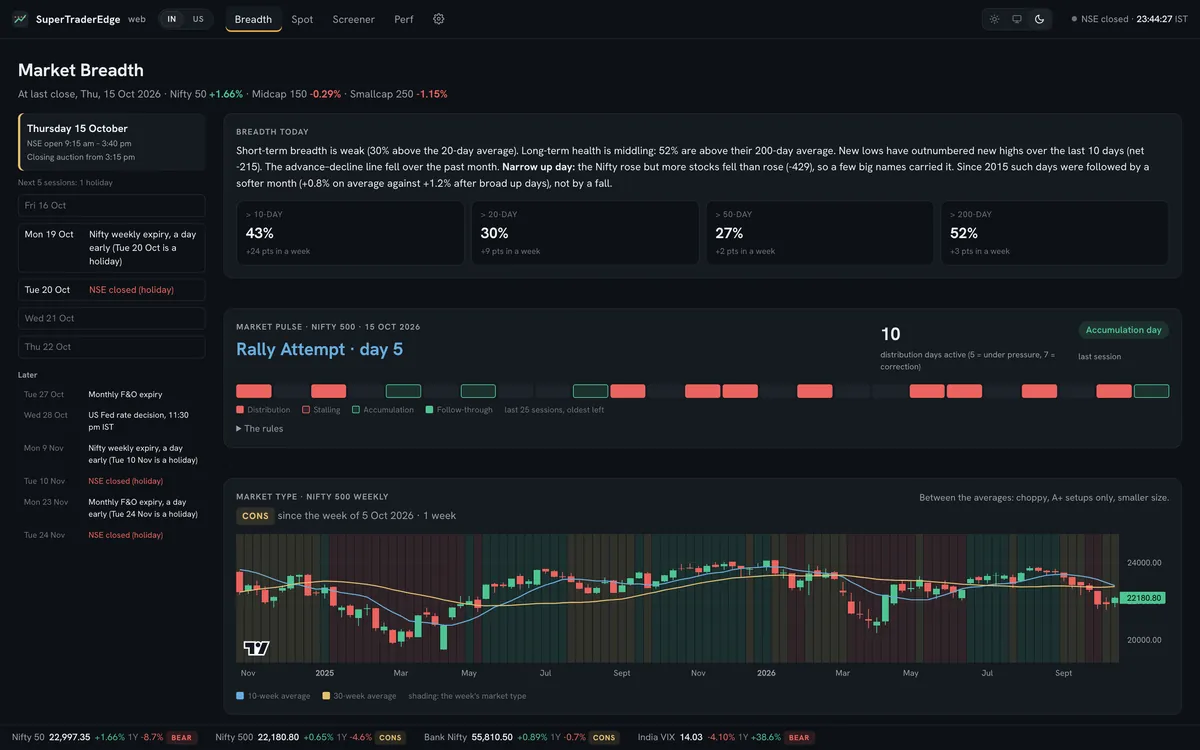
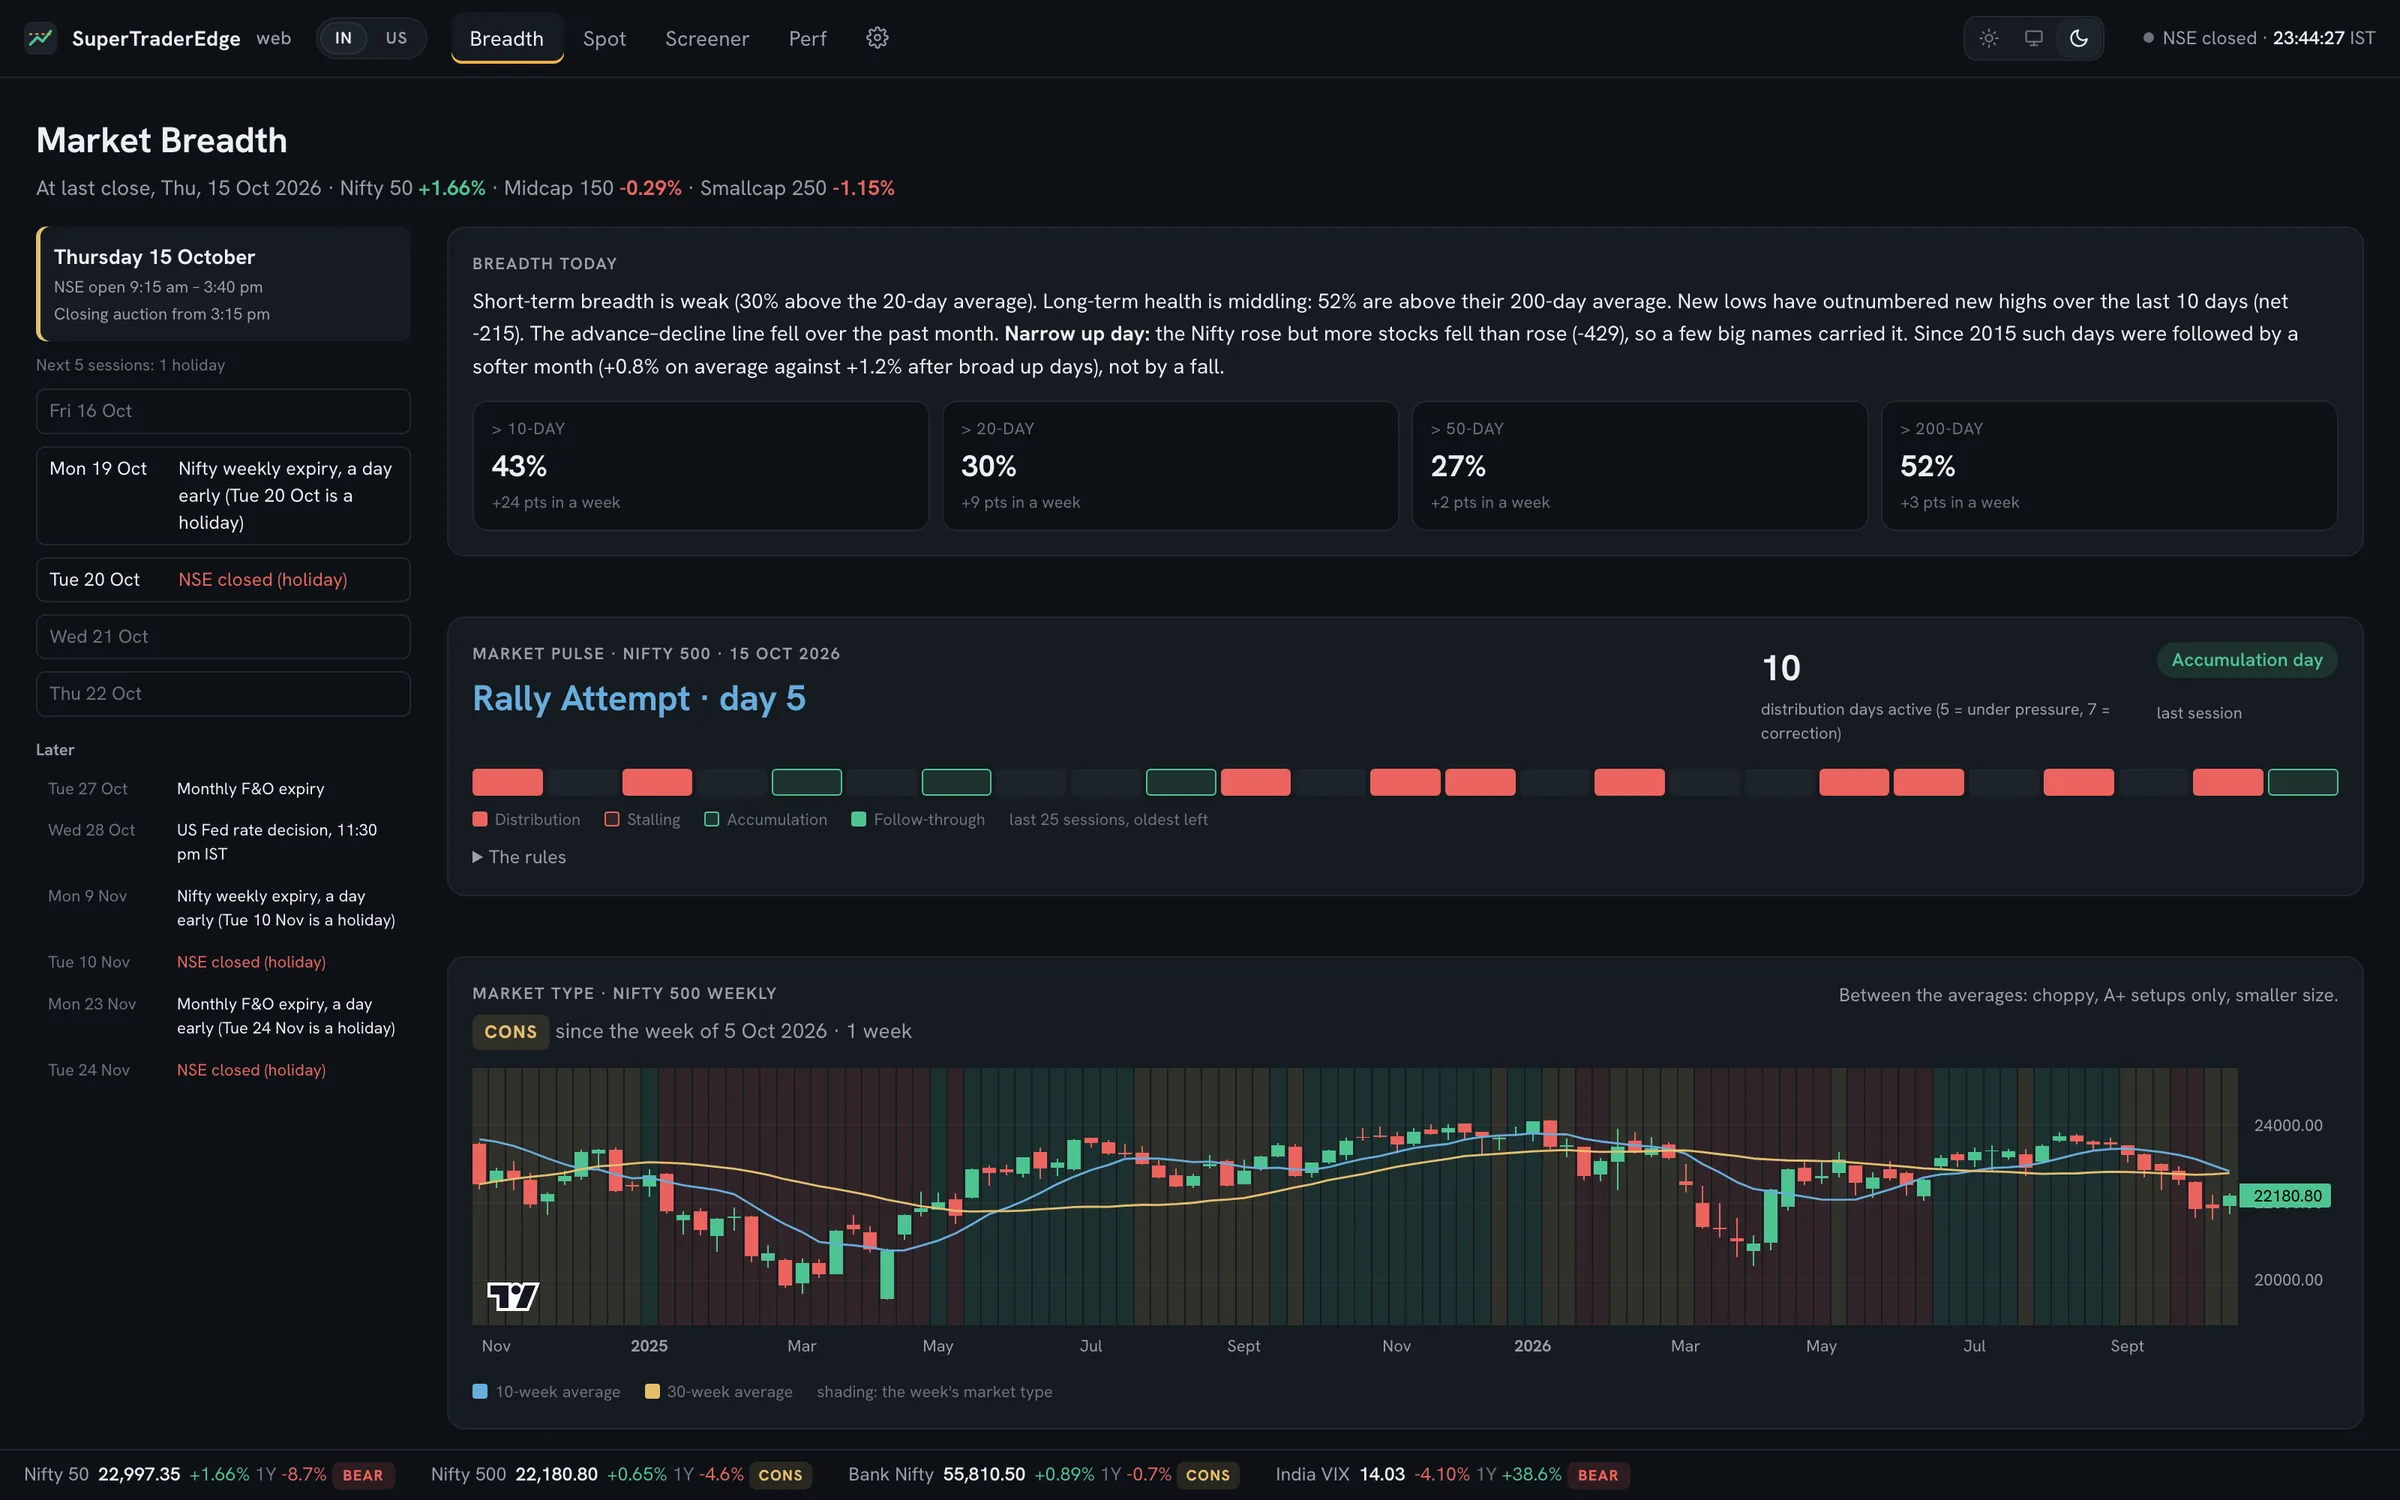
SuperTraderEdge Market Breadth page: breadth today, market pulse and market type for the Nifty 500
Breadth: how the whole market is doing, not just the index, with a plain-English reading of each chart.

Data shown is for representation only. Historical data is not included and has to be downloaded separately.

Breadth

Read the market before you read a chart.

Distribution days and the market pulse, the market type that tells you how big to trade, the share of stocks above their 10, 20, 50 and 200-day averages, new highs against new lows, the advance–decline line, and an index dashboard. Each chart comes with a one-line reading, so you know what it is saying.

  • Market pulse
  • Market type
  • % above averages
  • New highs & lows
  • A/D line
  • Trading calendar
Market Breadth with breadth today, market pulse and market type
Data shown is for representation only. Historical data is not included and has to be downloaded separately.

Spot

Charts that find the pattern for you.

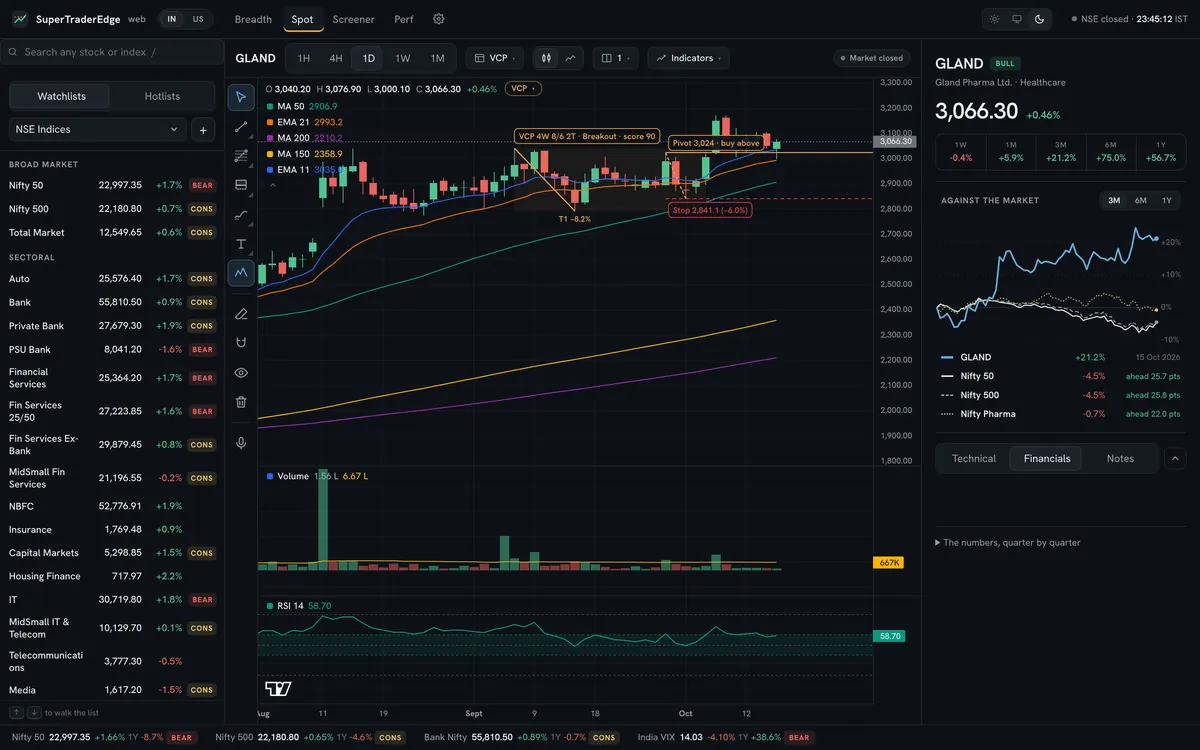
Hourly to monthly candles, 13 indicators, around 40 drawing tools, templates and multi-chart layouts. Auto patterns draw the VCP right on the chart, with pivot and stop. Beside it: how the stock is doing against its sector and the market, its technical score, and quarterly results with record profits glowing.

  • 1H to 1M
  • 13 indicators
  • ~40 drawing tools
  • Auto VCP
  • Hot lists
  • Financials
Spot chart of Gland Pharma with an automatically drawn VCP, pivot and stop
Data shown is for representation only. Historical data is not included and has to be downloaded separately.

Screener

Every setup, already drawn.

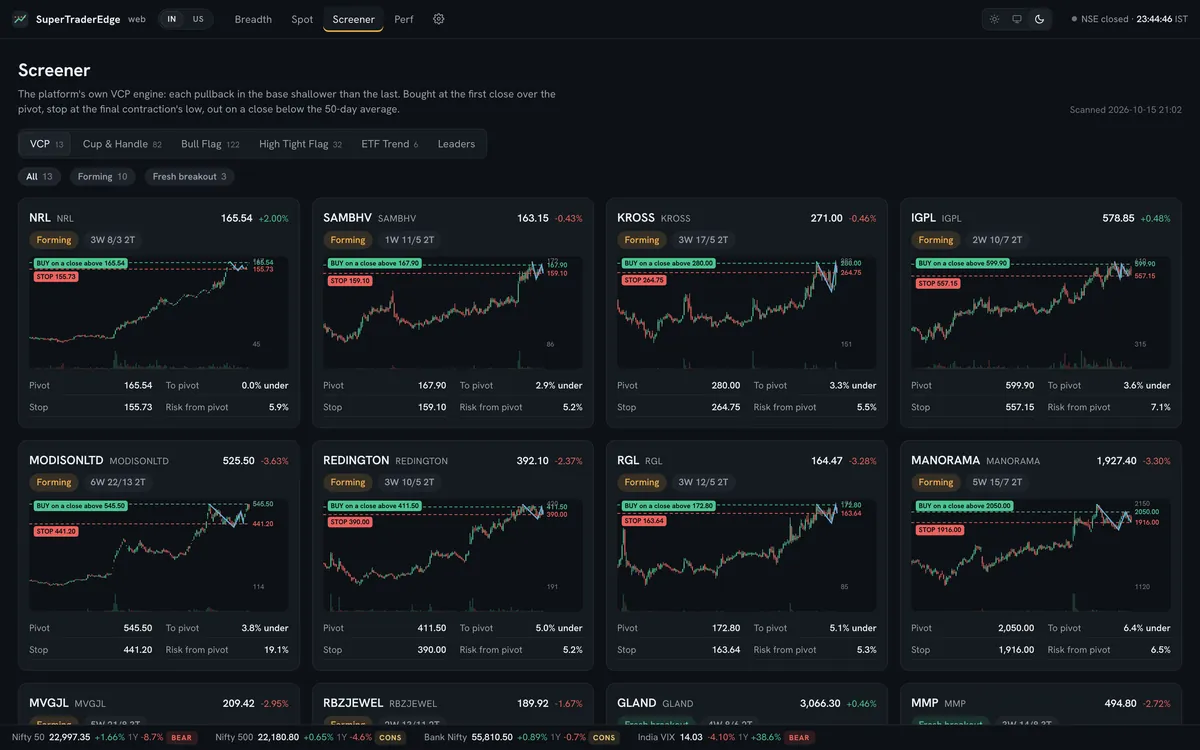
VCP, Cup & Handle, Bull Flag, High Tight Flag and ETF Trend, scanned across the market after every session. Each card draws the pattern with its buy point and stop, how far price is from the pivot, and the risk if you take it. A Leaders tab lists the strongest stocks by relative strength.

  • VCP
  • Cup & Handle
  • Bull Flag
  • High Tight Flag
  • ETF Trend
  • Leaders
Screener cards for VCP setups with buy points, stops and risk
Data shown is for representation only. Historical data is not included and has to be downloaded separately.

Perf

See where the money is rotating.

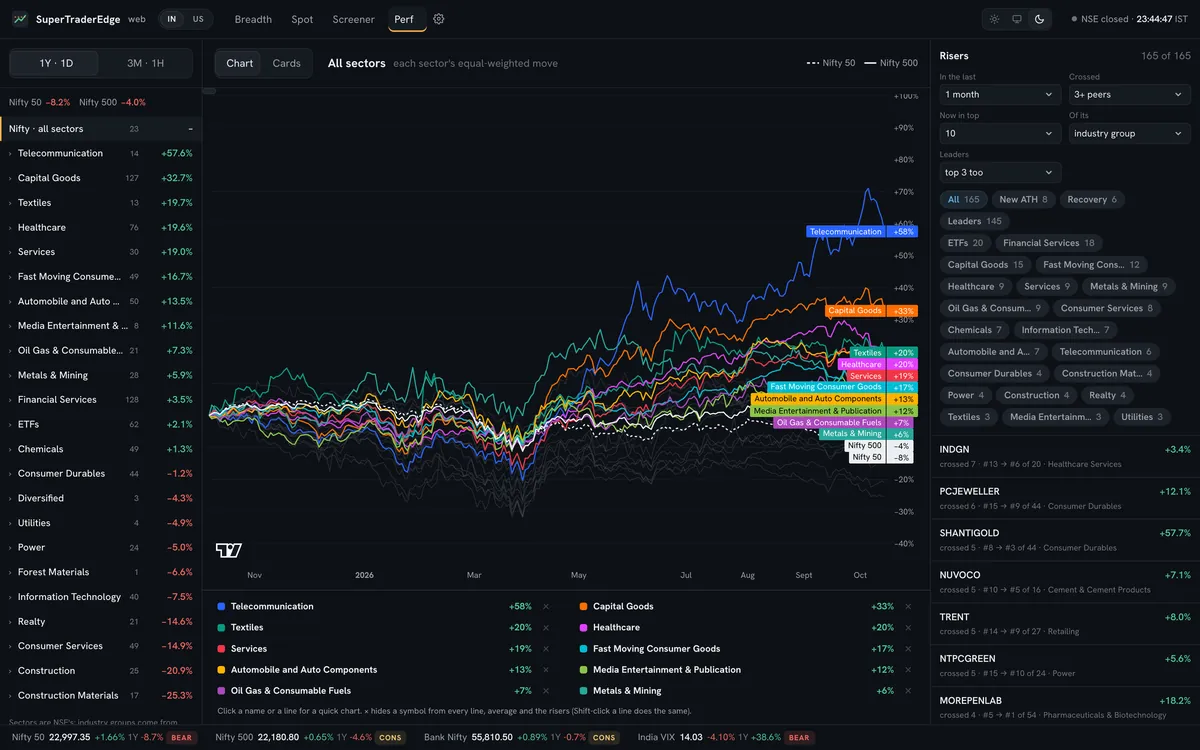
Every sector and industry group as a line against the Nifty 50 and Nifty 500, over a year or three months. Sector cards score strength, a rotation chart shows who is leading and who is fading, and Risers lists the stocks climbing their group's ranks.

  • Sector lines
  • Sector cards
  • Rotation chart
  • Risers
  • New ATH
Perf page showing every sector's move over a year against the Nifty 50 and Nifty 500
Data shown is for representation only. Historical data is not included and has to be downloaded separately.

Two markets, one switch

India and the US. Same pages, same rules.

Flip the IN / US switch and every page follows: breadth on the S&P 500, screeners across US stocks and ETFs, sectors by NASDAQ's groups, the NYSE calendar.

IN

India

Every NSE stock, split- and bonus-adjusted, delisted ones included. NSE indices, market caps and corporate actions.

US

United States

Every listed stock, the ETF universe, leveraged and inverse funds, and the S&P 500, Nasdaq-100, MidCap 400 and Russell 2000.

Your data, your choice

Bring your own data. It keeps itself current.

You source the data: ask your AI assistant to pull the history from NSE's website and other public sources. The platform then fills the gap to the latest finished session by itself, and real-time prices come from your own broker. Need help to bring data? Speak to aniketh@mindstorm.in.

NSEDaily bars, splits, bonuses, dividends, indices, market capsNSE's daily files · a few minutes
OptionsEnd of day for every Nifty contract, plus 1-minute chains since 2021NSE F&O files · under a minute
US StocksIndices, ETFs, leveraged funds and every stockPublic quotes · about two hours the first time

Real-time data flows from your own broker, directly. Fyers' API is free: add its data token and you get live prices in market hours, plus hourly bars and 1-minute option chains in the fill. Without a broker connection, everything else still fills.

Set up by your AI

Say "study the folder". It does the rest.

Open the folder in Claude Code, Codex or Antigravity. Your assistant reads the playbook that ships with it, asks where your data is, connects it and fills it to today.

Or do it by hand: put the pack in data/, double-click start, and the platform opens at localhost:8600. The first start fetches a private copy of Python for itself. Nothing to install first.

  • "study the folder"
  • "connect my data"
  • "update my data"

1 year of support

One year to make you independent.

You pay once, and the first year comes with support: getting set up, connecting your data, and learning to read every page. The goal is that by the end of the year you don't need us. You run the platform, and your trading, on your own.

  1. Set upPlatform running, data connected and filled to today.
  2. LearnBreadth, charts, screeners and sectors, until you read them yourself.
  3. IndependentWithin the year, you run it all without help.

Pricing

The platform, plus the markets you trade.

The Getting Started Platform is your starting point: the market view, the charts and the setups, for ₹17,999. One-time pay, no subscription, with a year of support. You source your own data. Need help to bring data? Speak to aniketh@mindstorm.in.

SuperTraderEdge Platform

Getting Started Platform · Windows · Mac · Linux

Getting Started PlatformOne-time pay · 1 year support · Breadth, Spot, Screener, Perf · Historical data not included ₹17,999
Data: source on my ownYour AI pulls the OHLCV data for stocks from NSE's website and other public sources Included

Need help to bring data? Speak to aniketh@mindstorm.in.

Speak to Aniketh

One-time pay No subscription. 1 year of support included.

Total incl. GST₹17,999
  • Runs in your browser, from a folder on your computer
  • Fills your data to the latest session every day
  • AI playbook for Claude Code, Codex and Antigravity
  • 1 year of support, to get you running it on your own
Buy now

Or pay by UPI

Send ₹17,999 from any UPI app, then email the screenshot. The download links come back to the same address.

For computers only, not phones or tablets. Windows, Mac or Linux, with about 100 MB for the platform plus room for your data. An internet connection keeps the data current.

Coming soon

System packs

The Getting Started Platform is where you begin. System packs build on it: complete trading systems you add to the platform: rules, numbers, signals and the equity curve, each in its own Systems tab. Install one by copying its folder in.

Tell me when they're out

FAQ

Before you pay. The awkward questions.

Is this a website I log in to?

No. It's a folder you keep on your computer. Starting it opens the platform in your browser at localhost:8600, which is your own machine. There's no account and no server of ours in the middle.

Does it work on my phone or tablet?

No. The Platform is built for a computer: it runs from a folder on a Windows, Mac or Linux machine and opens in that computer's browser. The charts and screeners need a big screen, so there's no phone or tablet version.

Is this a subscription?

No. The Getting Started Platform is one-time pay: ₹17,999 including GST, no subscription, no renewals, and it's yours to keep. It comes with a year of support.

What does the year of support cover?

Help getting set up, connecting your data, and learning to use every page. The goal of that year is simple: by the end of it, you run the platform on your own.

Do I need to install Python or anything else?

No. The first start downloads a private copy of Python and the packages it needs into the platform's own folder (about 100 MB, two minutes). Nothing else on your computer changes.

How does the data stay current?

Your pack holds the history up to the day it was made. The platform fills the gap from public sources (NSE's daily files for India, public quotes for the US) when it starts and every 30 minutes, and there's a Fill to today button in Settings.

Do I need a broker account? Where does real-time data come from?

Not for history: your data and the daily fill come from public sources and need no broker. For real-time prices, connect your own broker; the data flows straight from it to your computer. Fyers' API is free and adds live prices during market hours, hourly bars and 1-minute option chains.

Does it place orders?

No. It's for reading the market and finding setups. Orders stay with your broker.

Where does the data come from?

You source it. Your AI assistant can pull the OHLCV data for stocks from NSE's website and other public sources, and the platform keeps it filled to the latest session from there. Need help to bring data? Speak to aniketh@mindstorm.in.

Is this investment advice?

No. The platform shows data, patterns and statistics. What you trade, and how much, is your decision.

Trade with the whole market in view.

Get the Platform